MainGate MLP Fund
Home › Public Investment › MainGate MLP Fund
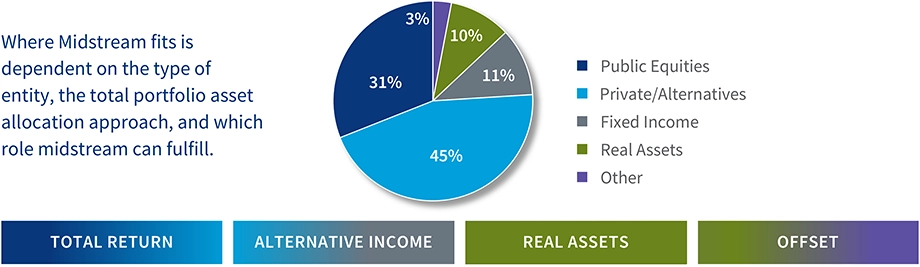
Midstream Opportunity Meets Mutual Fund Convenience
Now you can tap into the Midstream Energy asset class, including Master Limited Partnerships (MLPs), with the convenience of a mutual fund ... 1099 tax reporting, no K-1s or UBTI1, daily liquidity at NAV.
Objective
Strategies
•
•
MAINGATE MLP FUND HIGHLIGHTS
- 1099 tax reporting
- No K-1s or UBTI
- Performance potential compared to broader equity markets and other asset classes
- Income & growth potential
- Liquidity, transparency and flexibility
- Inflation-hedging potential
- Qualified retirement plan eligibility
- IRA eligibility
- Portfolio diversification
Performance
| as of 06/30/26 | AVERAGE ANNUAL RETURNS | ||||||||
| Share Class | Inception Date |
NAV/POP Per Share |
3 Month | Calendar YTD |
1 Year | 3 Year | 5 Year | 10 Year | Since Inception |
|---|---|---|---|---|---|---|---|---|---|
| Class A without load | 2/17/11 | $10.94 | 0.47% | 19.81% | 19.09% | 22.85% | 20.74% | 8.78% | 7.29% |
| Class A with 5.75% maximum front-end load |
2/17/11 | $11.61 | -5.28% | 12.94% | 12.25% | 20.45% | 19.30% | 8.14% | 6.88% |
| Class C without load | 3/31/14 | $9.68 | 0.33% | 19.49% | 18.27% | 22.00% | 19.87% | 7.96% | 4.82% |
| Class C with 1.00% Contingent Deferred Sales Charge |
3/31/14 | $9.68 | -0.66% | 18.49% | 17.27% | 22.00% | 19.87% | 7.96% | 4.82% |
| Class I | 2/17/11 | $11.71 | 0.61% | 20.08% | 19.41% | 23.19% | 21.07% | 9.06% | 7.57% |
Expense Ratios (Gross/Net): A Shares = 1.70%/1.70% | C Shares = 2.45%/2.45% | I Shares = 1.45%/1.45%. Gross and net expense ratios do not reflect a (1.10%) deferred income tax benefit which represents the performance impact of accrued deferred tax liabilities across the Fund, not individual share classes, for the fiscal year ended November 30, 2025 (the Fund had $0 in current tax expense and $9,064,336 in deferred tax benefit). The Fund is treated as a regular “C” corporation for U.S. federal income tax purposes. Therefore, the Fund accrues income tax expense/(benefit), which represents an estimate of the Fund’s potential tax expense/(benefit) if it were to recognize the unrealized gains/(losses) in the portfolio. The Fund’s accrued deferred tax liability, if any, is reflected in its net asset value per share on a daily basis. An estimate of deferred income tax expense/(benefit) depends upon the Fund’s net investment income/(loss) and realized and unrealized gains/(losses) on its portfolio, which may vary greatly on a daily, monthly and annual basis depending on the nature of the Fund’s investments, their performance and general market conditions. An estimate of deferred income tax expenses/(benefit) cannot be reliably predicted from year to year, and the estimate disclosed above will not be representative of the actual deferred income tax expense of the Fund on any given day. If the deferred tax benefit for the fiscal year ended November 30, 2025 was included, the gross and net expense ratios would be as follows: A Shares = 0.60% | C Shares = 1.35% | I Shares = 0.35%. The Fund’s adviser has contractually agreed to cap the Fund’s total annual operating expenses (excluding brokerage fees and commissions; Class A 12b-1 fees; borrowing costs; taxes, such as Deferred Income Tax Expense; and extraordinary expenses) at 1.50% through March 31, 2027.
The performance data quoted represents past performance. Past performance is no guarantee of future results. The investment return and the principal value of an investment will fluctuate and shares, when redeemed, may be worth more or less than their original cost. Current performance may be lower or higher than the information quoted. To obtain performance information current to the most recent month-end please call 855.MLP.FUND (855.657.3863). Performance data shown for Class A shares with load reflects the maximum sales charge of 5.75%. Performance data shown for Class C shares with load reflects the maximum deferred sales charge of 1.00%. Performance data shown for Class I shares does not reflect the deduction of a sales load or fee. Performance data shown “Without Load” does not reflect the deduction of the sales load or fee. If reflected, the load or fee would reduce the performance quoted.
The Fund’s investment objectives, risks, charges and expenses must be considered carefully before investing. The summary and statutory prospectus contains this and other important information about the investment company, and it may be obtained by clicking the link above or by calling 855.MLP.FUND (855.657.3863). Read it carefully before investing.
Sectors & Holdings
as of 06/30/26
Pipelines and Storage
Energy Transfer, L.P.
Cheniere Energy, Inc.
Williams Companies, Inc.
Enterprise Products Partners, L.P.
ONEOK, Inc.
DT Midstream, Inc.
Kodiak Gas Services, Inc.
Kinder Morgan, Inc.
11.68%
8.66%
8.66%
6.85%
5.97%
2.05%
1.06%
0.99%
Gathering/Processing
Targa Resources Corp.
Western Midstream Partners, L.P.
Antero Midstream Corp.
Kinetik Holdings, Inc.
17.35%
9.52%
1.04%
1.04%
Pipelines and Storage
MPLX, L.P.
Plains GP Holdings, L.P.
Phillips 66
Genesis Energy, L.P.
Enbridge, Inc.
11.67%
10.60%
2.00%
0.47%
0.39%
Fund holdings and sector allocations are subject to change at any time and are not recommendations to buy or sell any security.